KEY INSIGHTS
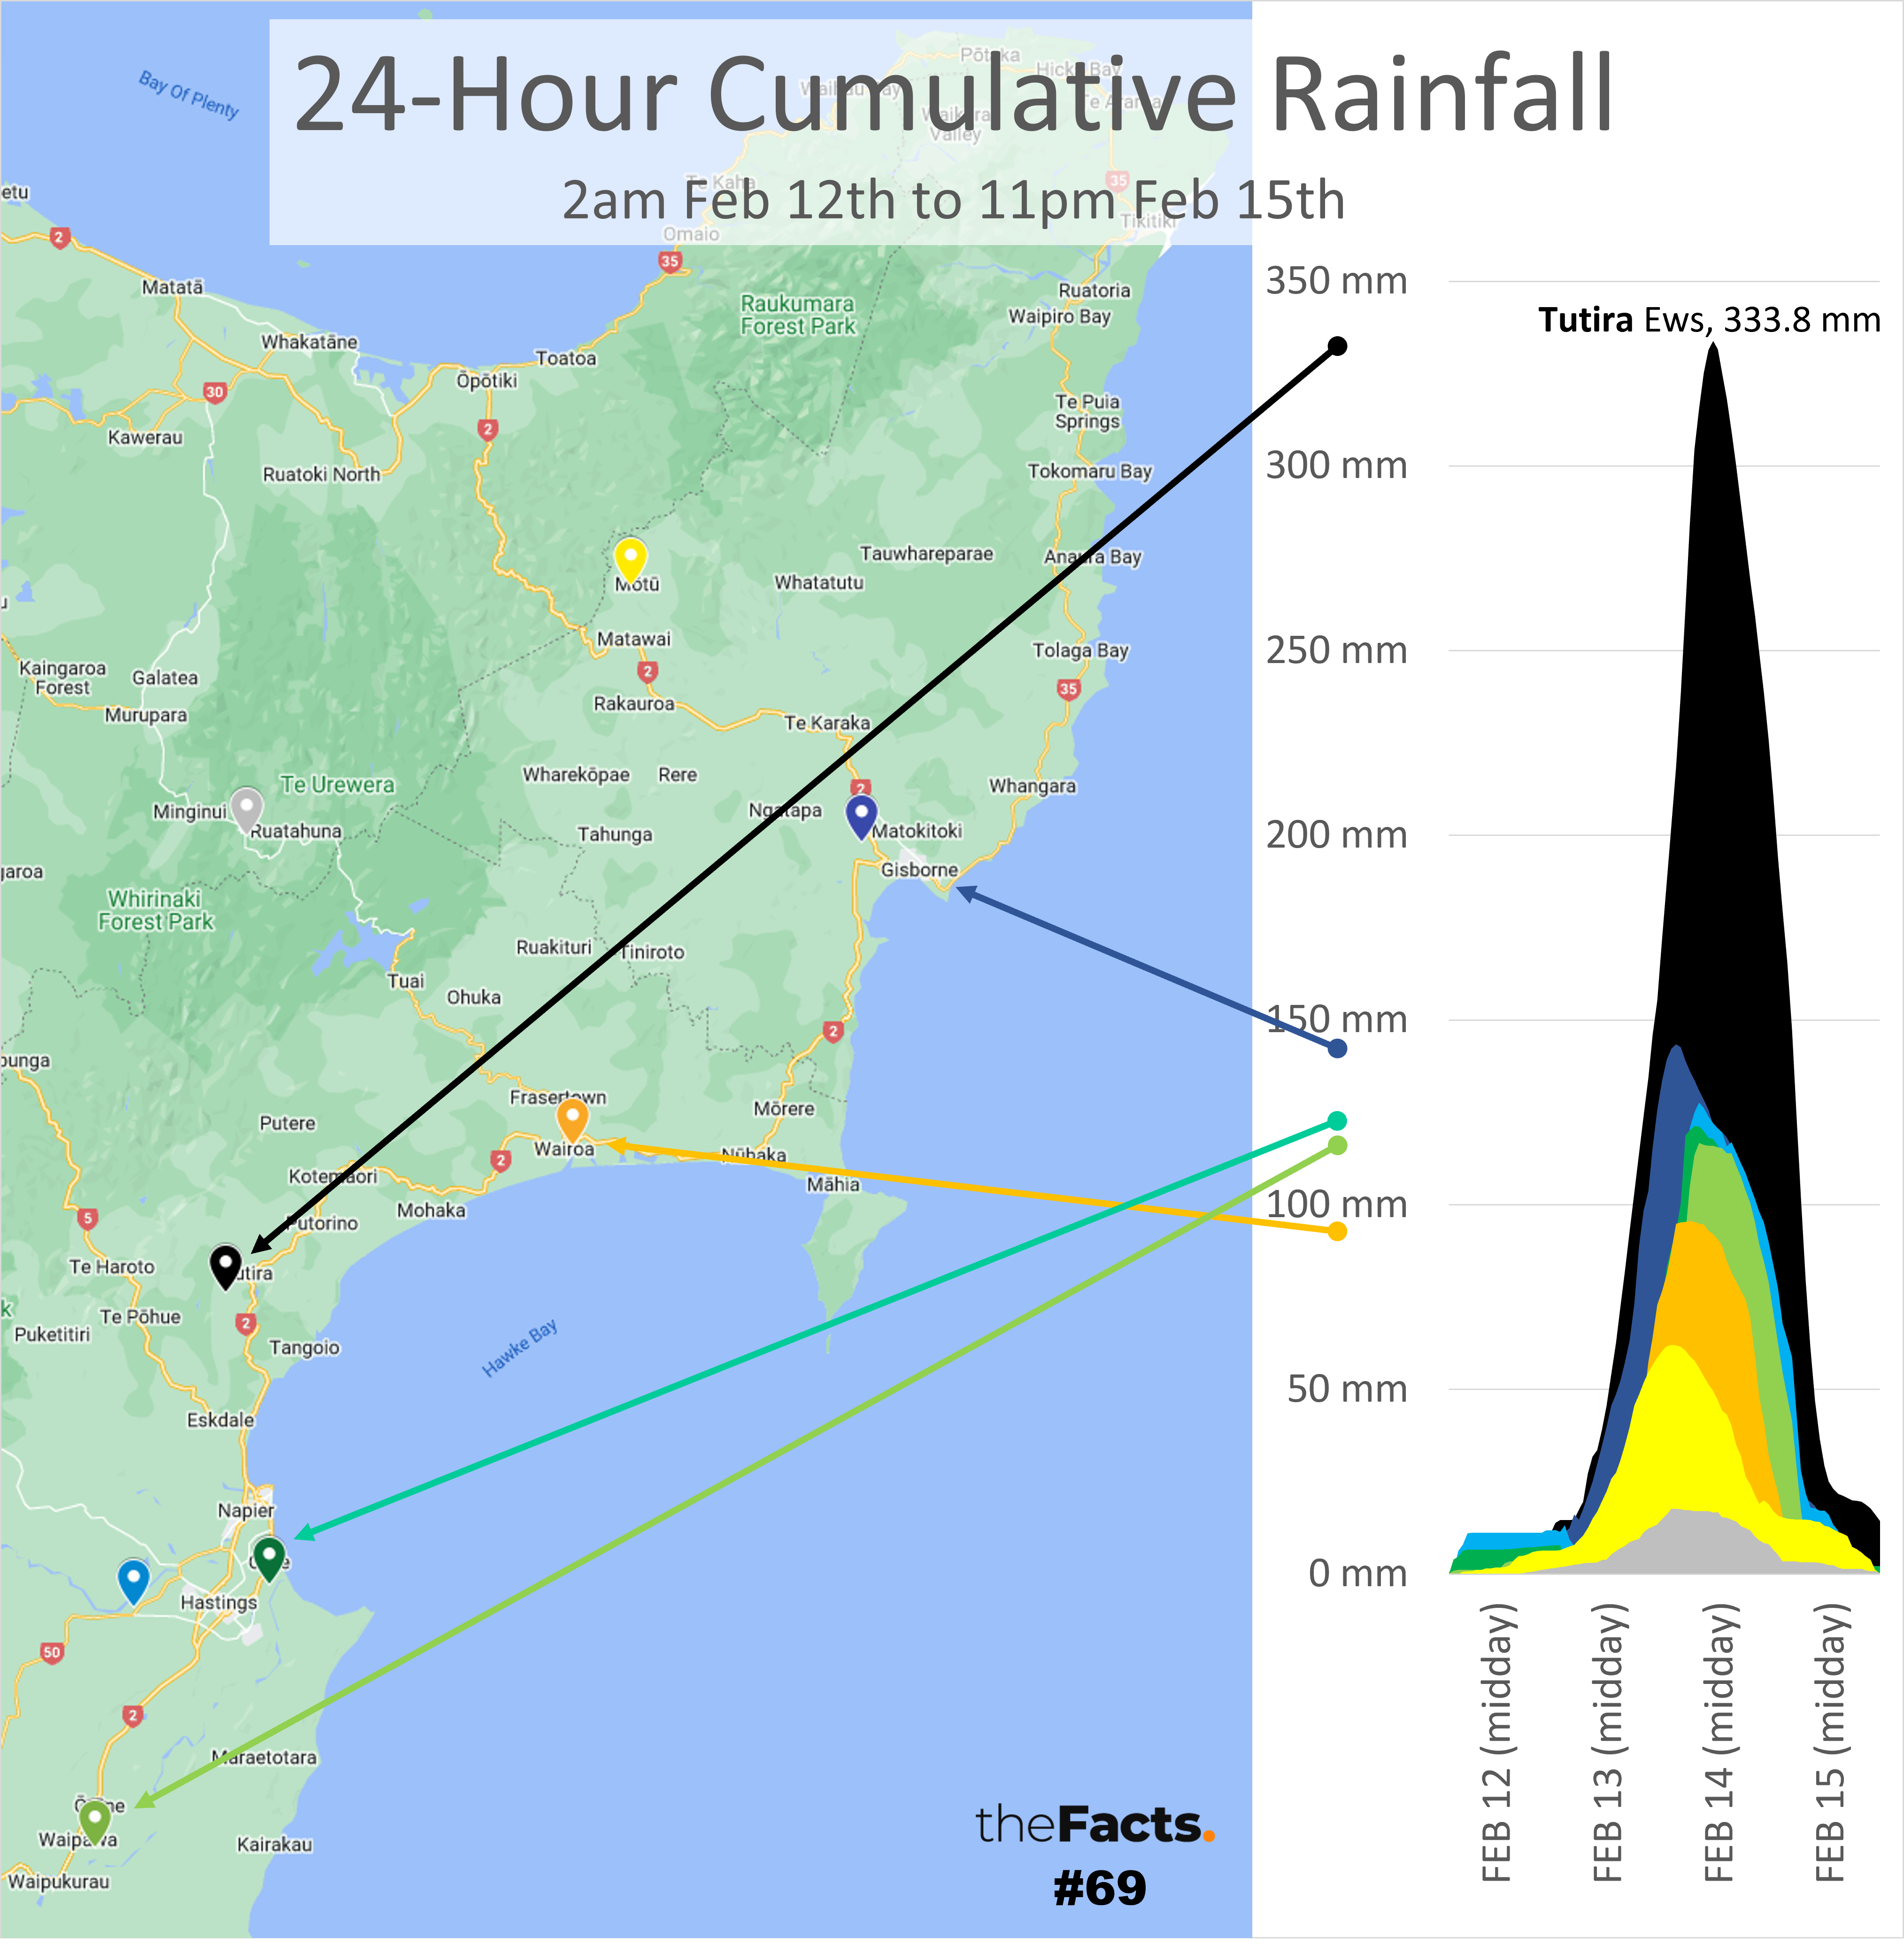
- The Tutira Cws (Compact Weather Station), which sits near the Esk River, had:
- >300mm of 24-hour rainfall for 10 hours in a row, with a peak of 333.8 mm by 11am on Valentine’s Day, February 14.
- >200mm of 24-hour rainfall for 23 hours in a row.
- >100mm of 24-hour rainfall for 37 hours in a row.
- The next highest 24-hour rainfall peak was the Gisborne Ews (Electronic Weather Station) with 143.4 mm – a significant amount of rain/flooding risk, but less than half of what Tutira experienced, and for a shorter rainfall window too.
- The Wairoa, North Clyde Ews to the north-east, and the Whakatu Ews (east of Hastings) and Maraekakaho Cws (west of Hastings) to the south peaked at 96-128 mm within any 24-hour window.
- Also see:
- https://thefacts.nz/environment/auckland-rainfall-flooding-january-2023/ for more insights on the Auckland flooding January 27.
- https://thefacts.nz/environment/north-island-floods-2023/ for more insights on the 3 weeks of North Island flooding from January 27 to February 16.
KEY QUESTIONS
- Given the “narrow corridors” of “atmospheric rivers”/heavy rainfall, do we need to invest in more localised weather forecasts? Is it even possible, feasible, or useful?
- Should the Government/taxpayer invest in a user-friendly live map that gives all New Zealanders free access to all electronic weather data as it happens?
- Should we be teaching weather interpretation skills in schools?
- If Wairoa got <100mm rainfall peaks within 24-hour windows, why did the town flood so badly?
Last week’s fact also asked:
- Were the forecasts accurate enough?
- Should rainfall be presented in cm not mm, since cm is more commonly used and more easily understood in everyday language?
- Were the emergency alerts set at the right levels and sent at the right times?
- Do we have sufficient flood maps, simulations, and exit plans?
- Do we need to invest more in stormwater infrastructure, including stronger stopbanks and forestry slash solutions?
- Is this a 1-in-200-year storm, or our new normal?
…
Have your say
…
Full data analysis
Please contact us if you would like the full analysis.
…
Notes:
- We used https://sims.niwa.co.nz/sims/ to locate all NIWA weather stations in the Hawkes Bay and Gisborne/Tairāwhiti Region that track hourly rainfall. We then used https://cliflo.niwa.co.nz/ to analyse the hourly rainfall and this returned data for 9 weather stations:
- Whakatu Ews
- Motu Ews
- Gisborne Ews
- Tarapounamu Ews
- Wairoa, North Clyde Ews
- Waipawa Ews
- Tutira Cws
- Maraekakaho Cws
- Wairoa Aero Aws (no data after 1pm on February 14 so we haven’t shown this in the graph above)
- AWS (Automatic Weather Station) Sites are owned and operated by Met Service. They are listed on NIWA’s land station database and CliFlo but NIWA does not have the permission to distribute the data from them. If you want this, you will need to contact the MetService data enquiry team.
- AWS and EWS (Electronic Weather Station) are similar terms. NIWA uses the term EWS to make the distinction between their stations and MetServices.
- We decided to only show the Hawkes Bay and Gisborne/Tairāwhiti Region rainfall over the February 12-16 period due to the extreme flooding there. We realise that there has since been significant flooding in the likes of Mangawhai with over 330mm of rain also recorded in a day.
- Rainfall is typically measured in mm due to the (usually) small numbers.
- All numbers are provisional and subject to revision.
Thank you to the Factors who helped pull this together.
…
SOURCE:
- Weather stations = https://sims.niwa.co.nz/sims/
- Weather data = https://cliflo.niwa.co.nz/
- Daily rainfall for towns and cities = https://www.metservice.com/towns-cities (click on the location and then Past Weather > Last 30 Days)
Data published by National Institute of Water and Atmospheric Research
(c) Crown Copyright
Licensed for use under the creative commons attribution licence (BY) 4.0
…
Did we make a mistake, or have you got smarter data? Let us know.