KEY NOTES
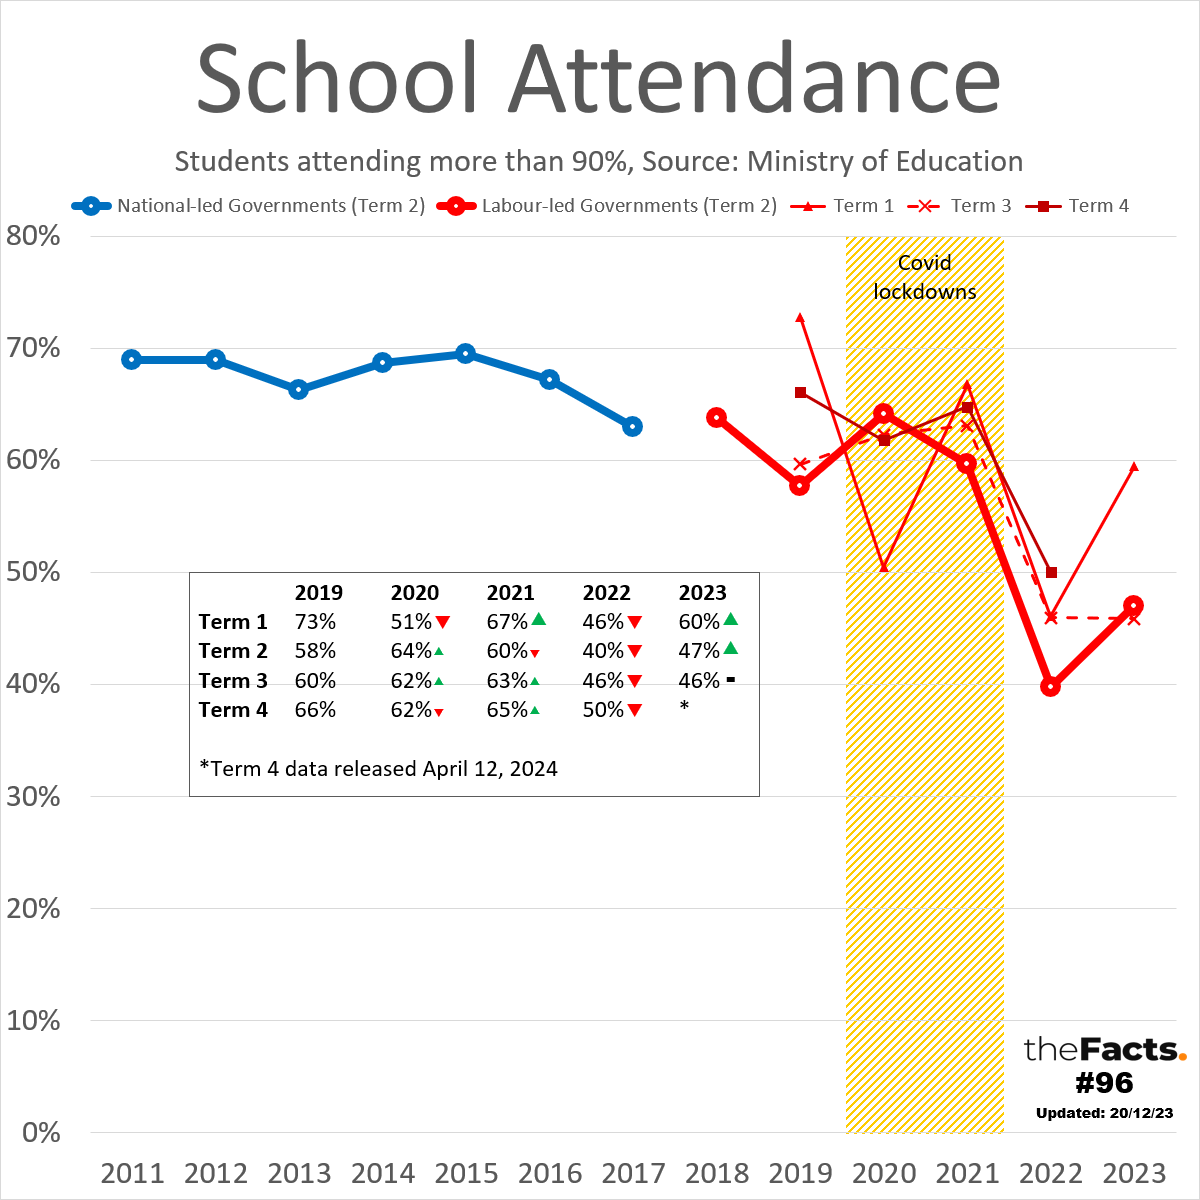
- The most commonly used attendance metric by politicians, media, and the Ministry of Education is the 90% rule which measures what % of children currently attend 90% of school days (9 days each fortnight).
- This attendance data from the Ministry of Education started in 2011.
- From 2011 to 2018, only term 2 data was recorded, which is why it’s the only comparison we have a) over 10+ years and b) between governments.
- From 2019, attendance data for all 4 terms was recorded. Attendance varies greatly between terms, which is why it’s best to plot/analyse each term separately, e.g. term 2 typically has the lowest attendance being winter.
- It normally takes ~2.5 months for this data to be released. Term 2 data has a bit more information and is scheduled for release 4.5 months later.
KEY INSIGHTS
- Term 3 2023 attendance was again below 50%. 1% lower than term 2 2023.
- This is the lowest ever term 3 attendance score. It is significantly lower than the 2019, 2020, and 2021 term 3 figures, and fractionally lower than 2022.
- Overall, school attendance has been steadily dropping since 2015
- Attendance dropped significantly in 2022 for all 4 terms
KEY QUESTIONS
- Education is ranked the 9th most important issue by New Zealanders. Do you believe this is the correct priority position?
- Are these declining attendance rates a concern? If so, how much? If not, why not?
- How do we apportion the cause of these declining metrics between our:
- Covid response
- Education policies/governance
- Teacher-only days/strikes
- School closure days, e.g. bad weather
- Cost of living pressures
- Other social factors?
- Can we determine from this data that National-led Governments outperform Labour-led Governments on educational attendance?
- Why does it take 2.5 months for the term 1/3/4 data to be released, and 4.5 months for term 2? Should it be faster?
- How do we improve school attendance again? (Assuming we want to.)
…
HAVE YOUR SAY


…
FULL DATA ANALYSIS
Please contact us if you would like the full data set and research.
…
NOTES:
- All publicly available years and terms have been published.
- The data includes primary and secondary schools.
- From the Ministry of Education:
Submitting regular attendance data is voluntary. In Term 3 2023, 94.6% (2,291) of all schools and kura provided useable attendance data. This covers 97.2% of the student population in all state and state-integrated schools and kura on 1 July 2023.
This may mean that the actual attendance across the entire population is lower or higher than this 46% figure. - Attendance reports are anonymous, so we can’t see which schools are performing best and worst.
- The Ministry of Education has explained that it takes 4.5 months for the term 2 data to be released due to it being a more comprehensive data set, but say they are committed to improving this turnaround time.
- From the Ministry of Education:
- A student is counted as present on-site if they are on-site at any time during a day.
- Similarly, a student is counted as off-site (learning at home) if they are recorded as learning at home at any time during a day.
- If a student attends school for part of the day and learns from home the rest of the day, that student is counted in each category: once for attending on-site and once for learning at home. [Note from theFacts: this will inflate attendance levels slightly]
- Students are not included as learning at home if:
- they are unwell
- they are absent due to parent concerns about the risk of contracting COVID-19, or
- the absence is unexplained
- There are many variables that impact school attendance, including:
- Covid response/lockdowns
- Education policies/governance
- Teacher-only days/strikes
- School closure days, e.g. bad weather
- Cost of living pressures
- Other social factors
- Excel defaulted the maximum vertical axis range at 80%, and we felt it was fair to leave it as that since 100% attendance is never possible with sick leave and other sporting and family commitments.
- We have plotted all term data on the same vertical plane. When we get time, we will work out how to shift this slightly into 4 quarters. As a citizen-funded and volunteer social initiative, we have limited resources.
- We chose blue for National-led governments and red for Labour-led governments, being their party colours.
- We use the Covid yellow stripes to represent that period of lockdowns.
- All numbers are provisional and subject to revision.
Thank you to the Factors who helped pull this together.
…
SOURCES:
- School Attendance Data = https://www.educationcounts.govt.nz/statistics/attendance
Data published by The Ministry of Education
(c) Crown Copyright
Licensed for use under the creative commons attribution licence (BY) 4.0
- Covid lockdown history = https://covid19.govt.nz/about-our-covid-19-response/history-of-the-covid-19-alert-system/
…
Did we make a mistake, or have you got smarter data? Let us know.